

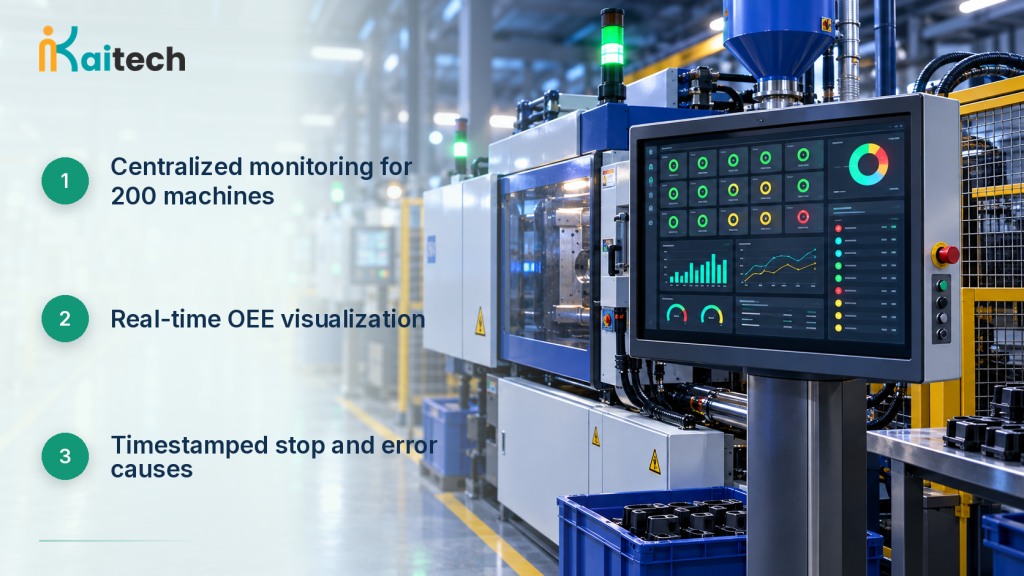
Whether 200 molding machines are running, stopped, or stopped for what reason — right now. KAITECH built an OEE monitoring system that shows the status of every machine on the factory floor in real time.
■ The Challenge
This customer runs a plastics factory and needed to see the real-time status of around 200 injection-molding machines, with reports on productivity, mold-switching time, running/stopped/error time, and the reason for each error with a timestamp. Previously, each machine’s status had to be checked individually, making it hard to see the factory’s overall operating picture at a glance.
■ Our Approach
KAITECH built a fully custom solution from scratch to match this customer’s requirements. Data is collected from each molding machine over LoRa, storing running/stopped/error status, production counts and mold-switching time as time-series data. A Grafana-based dashboard shows each machine’s OEE (availability, performance, quality) at a glance, making it easy to spot underperforming machines or recurring errors immediately. The backend runs on Flask and FastAPI, with MySQL, MongoDB and InfluxDB as the data stores.
■ Results & Highlights
- Brought real-time, centralized visibility to around 200 molding machines’ operating status
- Recorded mold-switching time and the cause of every stop or error with a timestamp, feeding directly into improvement activities
- Visualized OEE per machine, making it possible to spot underperforming machines instantly
- Shifted floor-status tracking from manual visual checks to data-driven decisions
■ Why KAITECH Was The Right Fit
Collecting uninterrupted data from around 200 machines and turning it into meaningful indicators required thinking about communication protocol and dashboard design as one connected problem. KAITECH combined its experience with LoRa’s low-power, long-range communication with dashboard design in Grafana, shaping it into something floor managers could actually use.
■ Tech Stack
LoRa, Flask, FastAPI, React, MySQL, MongoDB, InfluxDB, Grafana